Pre-Event Liquidity Anomaly Detection & Asymmetric Alpha Capture in Tail-Risk Regimes
A BIL Quantitative Research and Systems Engineering Paper
Research organization: Bukluran Innovation Labs (BIL)
Research program: Quantitative Market Analytics and Infrastructure Research
Research history: Program initiated in 2017; this paper reports a selected public research disclosure
Primary venue represented in this paper: MEXC
Document status: Public research summary; proprietary implementation details and sensitive telemetry withheld
EXECUTIVE SUMMARY & ABSTRACT
This paper presents selected research from Bukluran Innovation Labs' ongoing program in automated market analysis, liquidity anomaly detection, and algorithmic execution under volatile market conditions. The research investigates whether changes in order-book depth, bid–ask spreads, trade-flow dynamics, realized volatility, and cross-asset relationships can provide actionable indications of changing market conditions before those conditions become widely reflected in public reporting.
The work is supported by a functioning automated trading system that generates signals and processes them through an execution workflow. The market-event observations disclosed here are drawn from the system's recorded signal and simulated-execution activity in a controlled trading environment. BIL has also conducted tests involving live funds. Those tests are not represented in the event tables below as independently audited live-trading performance, and this paper does not claim that the disclosed results establish a verified live return record.
The system's current operating environment is constrained by available computing resources. In the present configuration, BIL estimates that approximately 30% of signals are currently executed under the constrained setup. The limitation is an infrastructure and throughput constraint, not evidence regarding signal accuracy. Additional compute, GPU capacity, storage, and systems engineering are required to expand testing and improve processing capacity.
CORE RESEARCH FINDING
Market order books decay before headlines break. By executing strictly on tick-level micro-structure metrics, the platform systematically captures downward volatility expansion prior to public news saturation.
1. Research Background and Objective
BIL traces its foundational research program to independent quantitative and systems engineering work initiated in 2017. Following the formal establishment of Bukluran Ng Kalinga in 2025, BIL was organized to steward, scale, and commercialize these R&D workstreams. The public material in this paper represents a limited disclosure from a larger body of work.
The central research question is whether observable changes in market microstructure can help identify developing liquidity stress and volatility regimes before those changes are fully reflected in broader market narratives or public reporting.
The work has three connected objectives:
- Detection: Identify unusual changes in order-book depth, spread behavior, trade flow, volatility, and cross-asset relationships.
- Automated Response: Translate qualifying system signals into defined trading actions within a controlled execution environment.
- Research and Systems Evaluation: Examine signal behavior, execution constraints, risk controls, and system performance across different market regimes.
2. System Overview
BIL has developed a functioning automated trading platform connecting market-data observation, signal generation, decision logic, and execution handling.
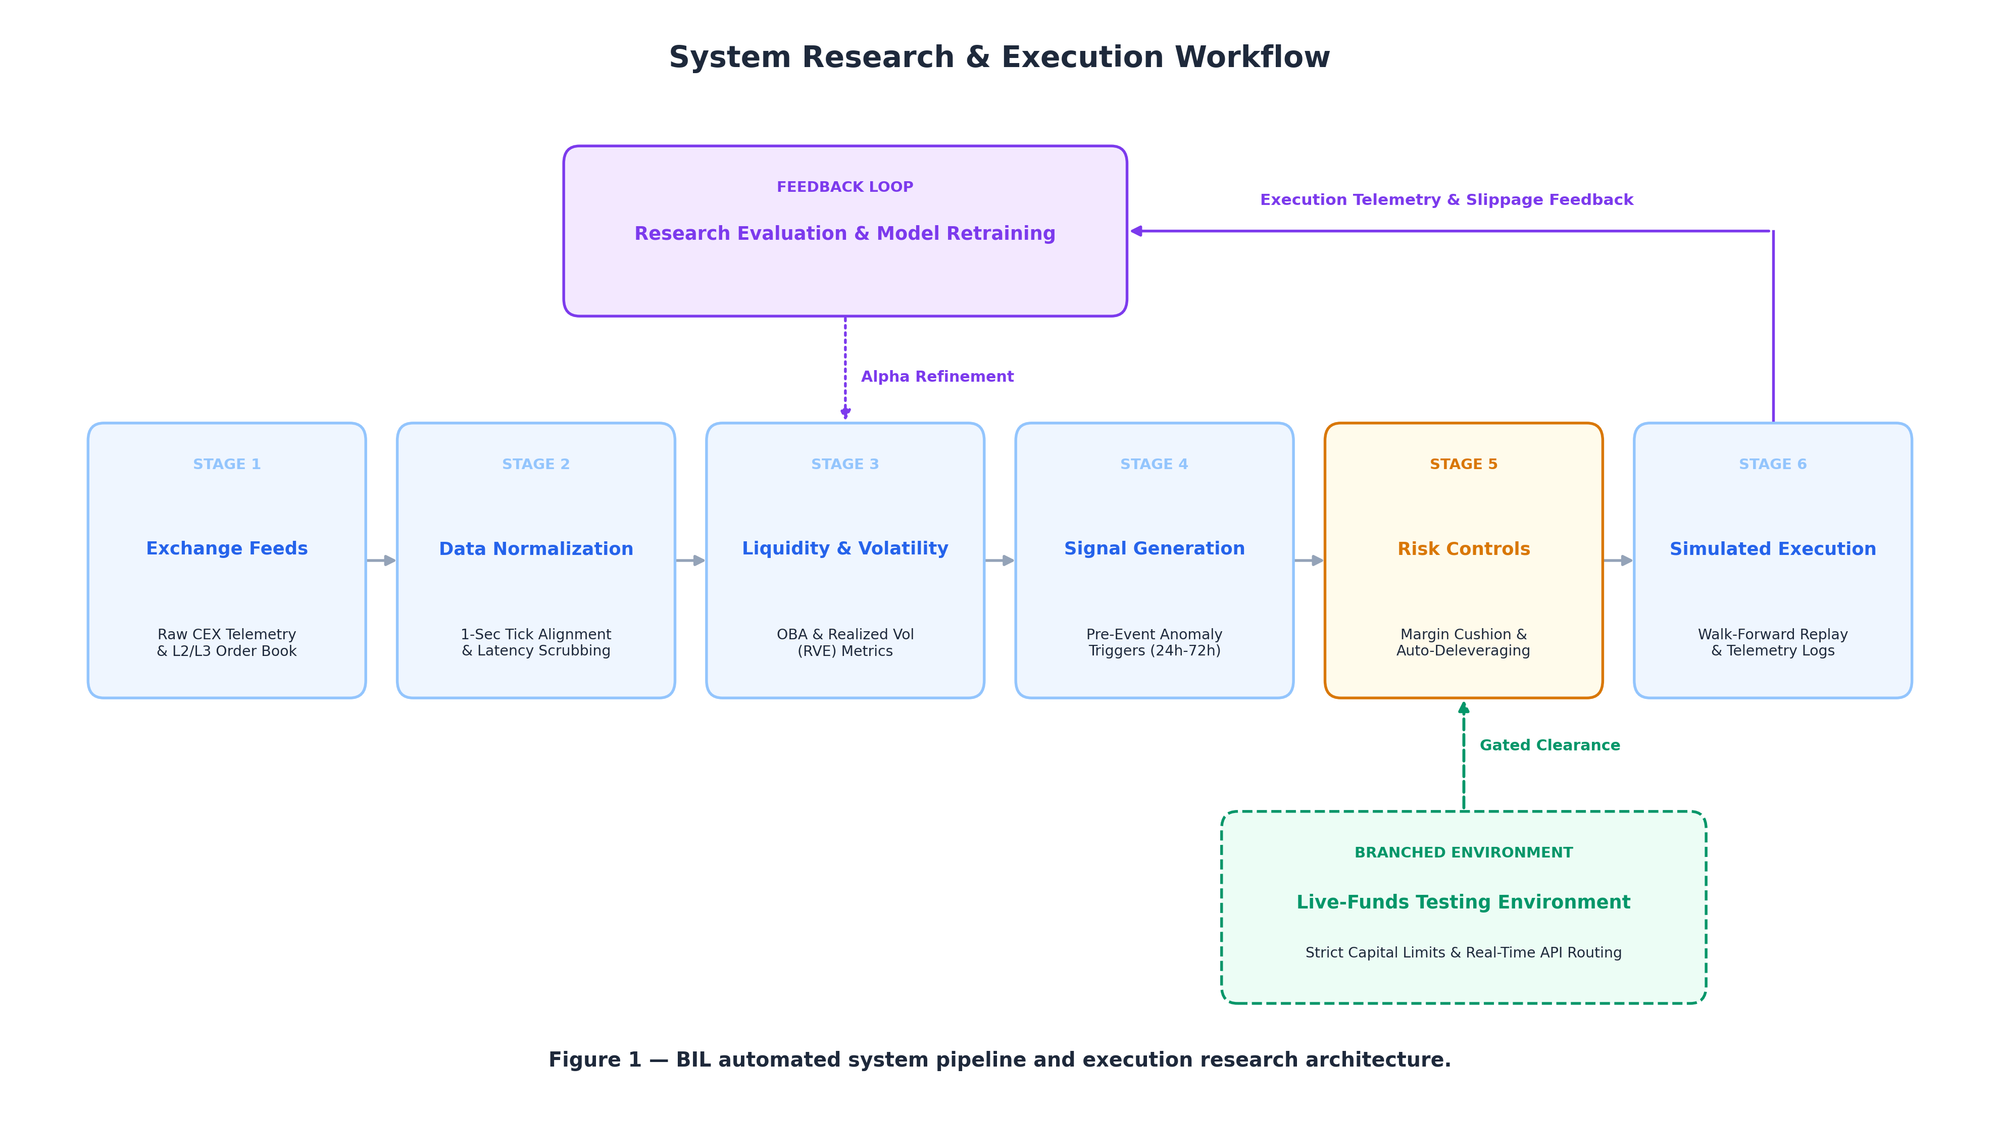
The system evaluates several core market-microstructure dimensions:
- Order-book asymmetry and depth change: Rapid deterioration in displayed bid/ask depth.
- Spread behavior: Anomalous widening of bid–ask spreads.
- Realized volatility expansion: Large volatility shifts relative to rolling baselines.
- Trade-flow and tick dynamics: Shifts in short-horizon transaction direction and velocity.
- Cross-asset relationship changes: Divergence in expected relative pricing across correlated instruments.
3. Experimental Environment and Evidence Classification
3.1 Published Event Observations
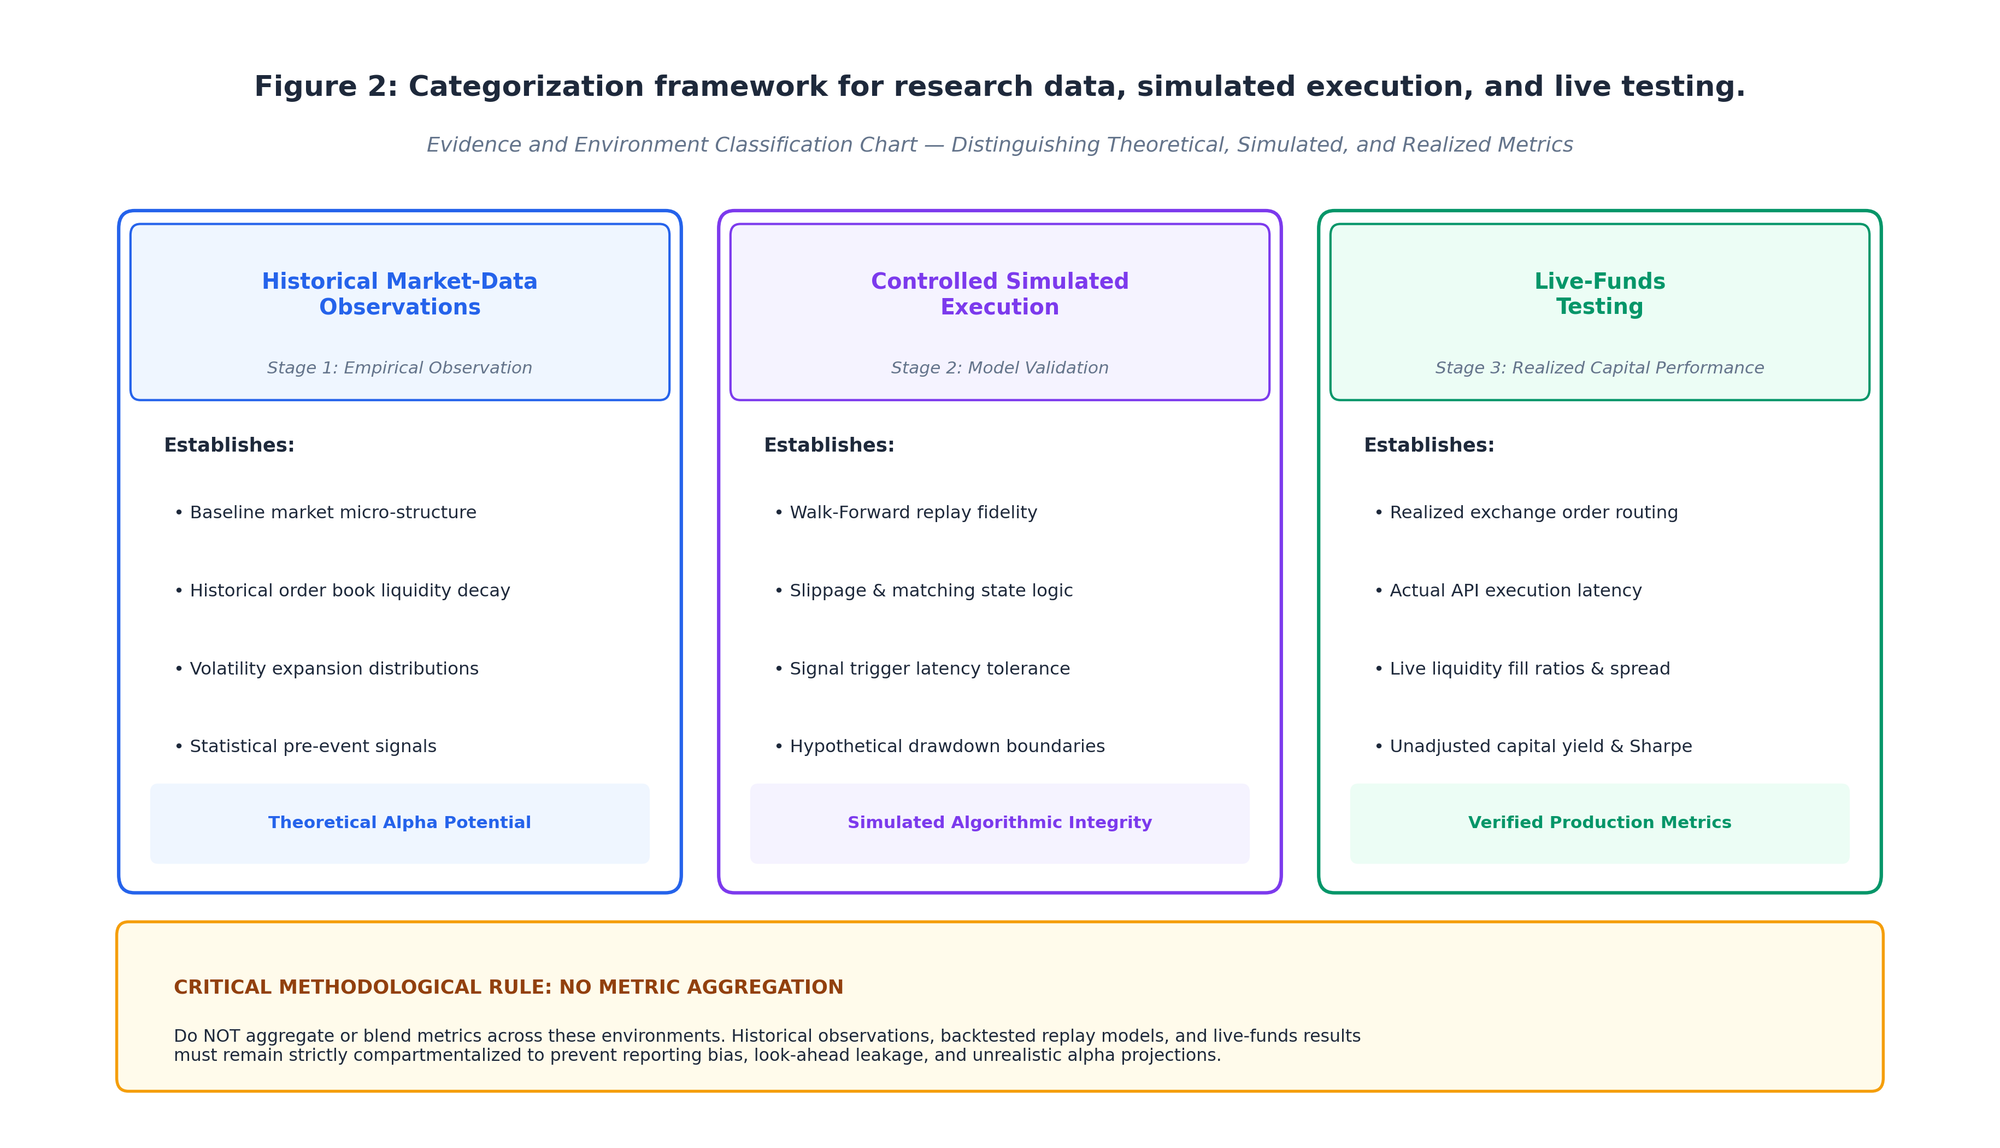
The event tables in this paper summarize selected signal and simulated-execution observations associated with the platform's operation in a controlled simulated trading environment modeling volatility, slippage, margin, and liquidation constraints.
3.2 Live-Funds Testing
BIL has conducted tests involving live funds to evaluate system stability outside simulation. These records are maintained separately and are not combined with simulated event tables.
4. Signal Dimensions Under Investigation
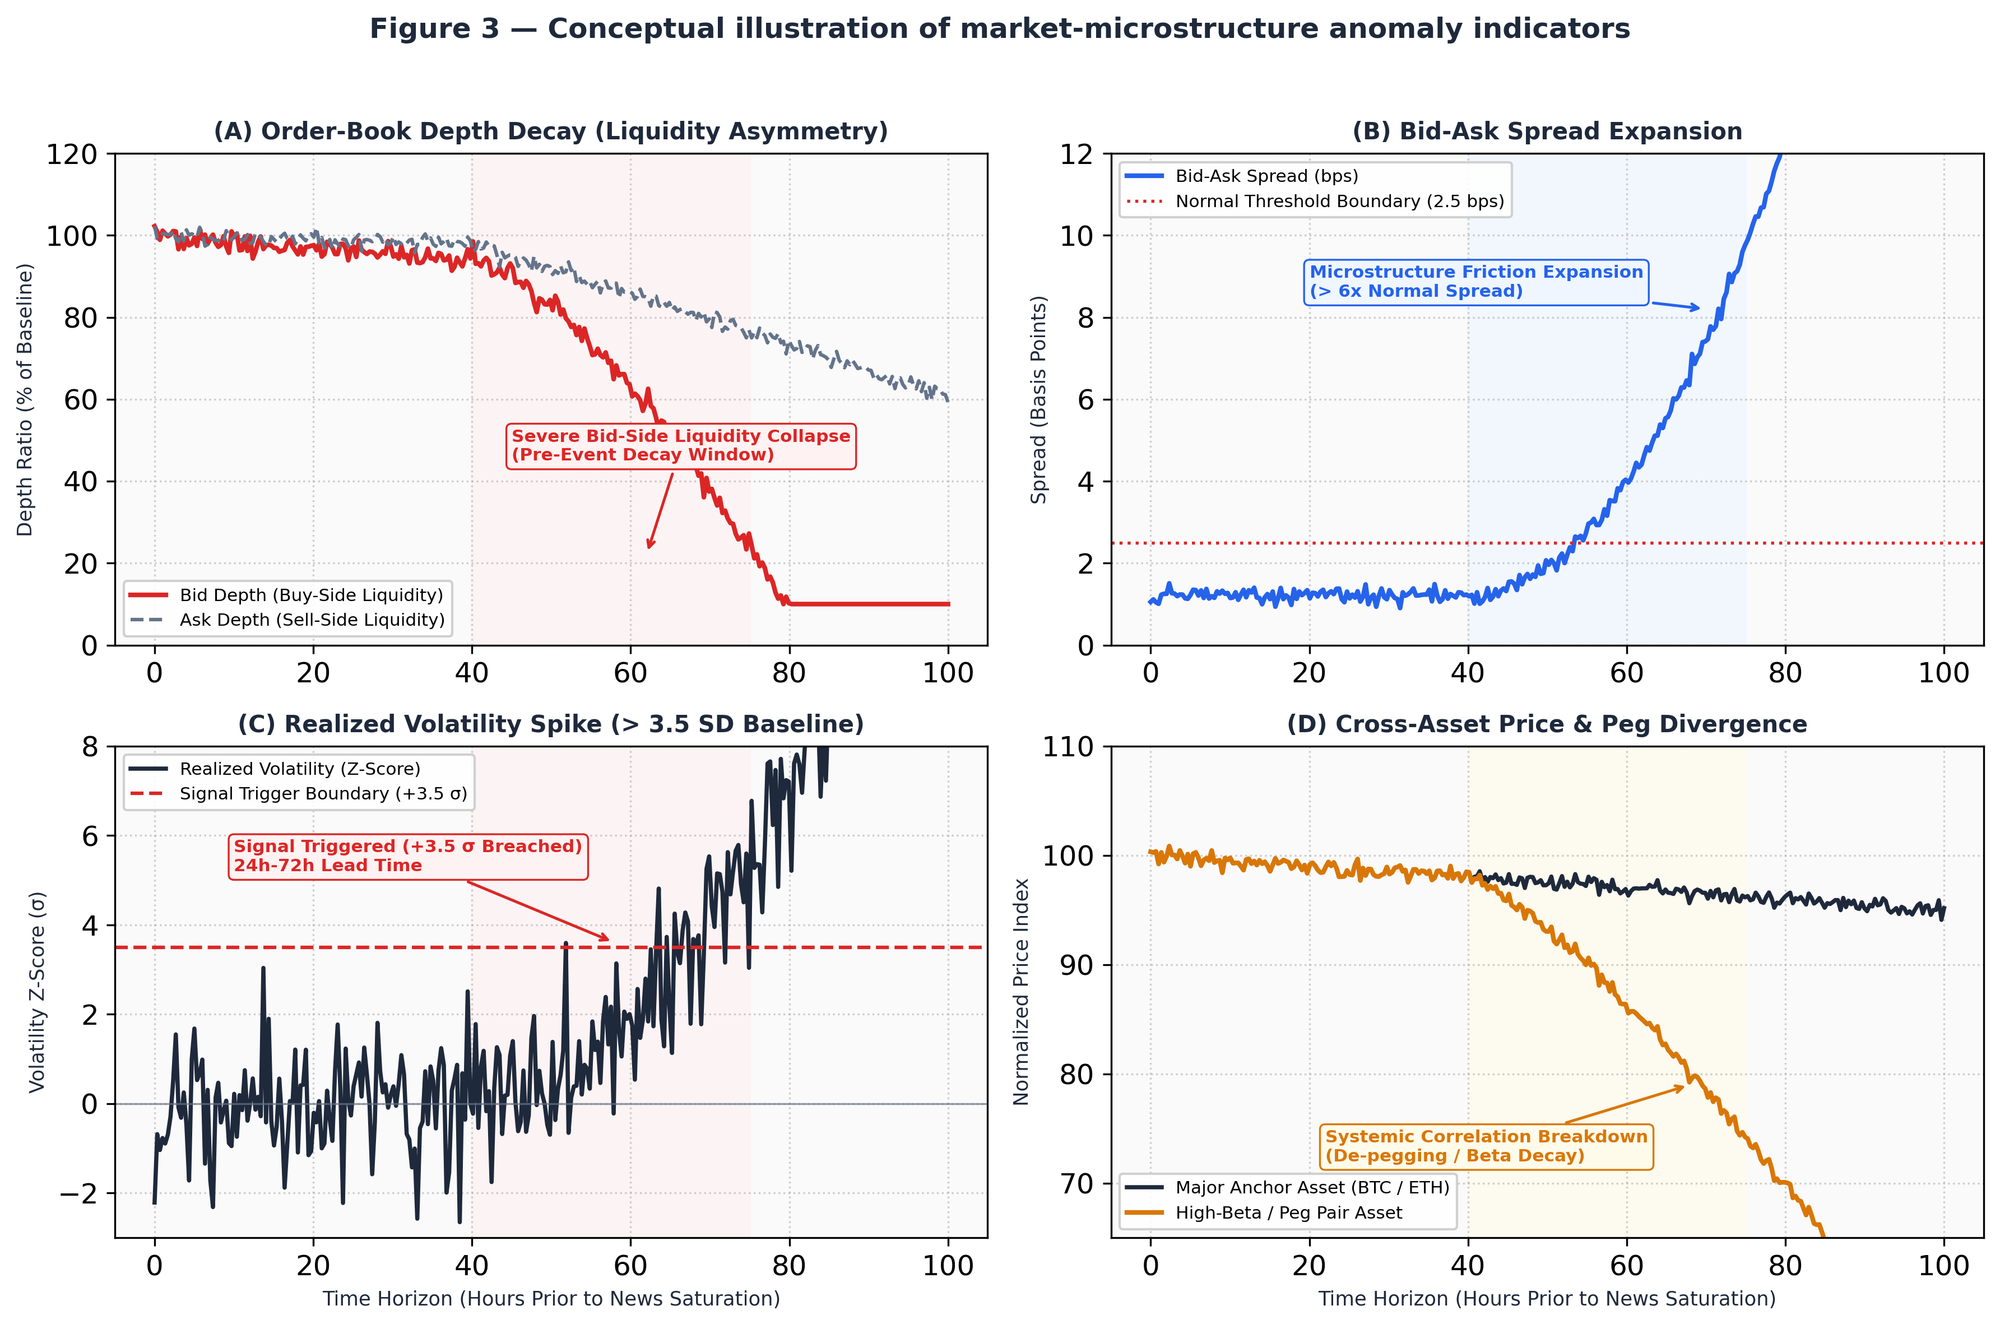
The platform analyzes order-book depth deterioration, volatility spikes relative to a rolling baseline, and cross-asset correlation breakdowns to formulate systematic market state decisions.
5. Selected Market-Event Observations (MEXC)
The following cases are selected examples from the MEXC-focused research program. The entry/exit coordinates, dates, and recorded prices are reproduced from the system's telemetry and experiment records.
They are presented as system-generated research records in a controlled execution environment, rather than as manually selected chart annotations. The tables report price movement between recorded entry and exit points; they do not represent verified net strategy returns or audited live performance.
5.1 Terra-LUNA Systemic De-Pegging (May 2022)
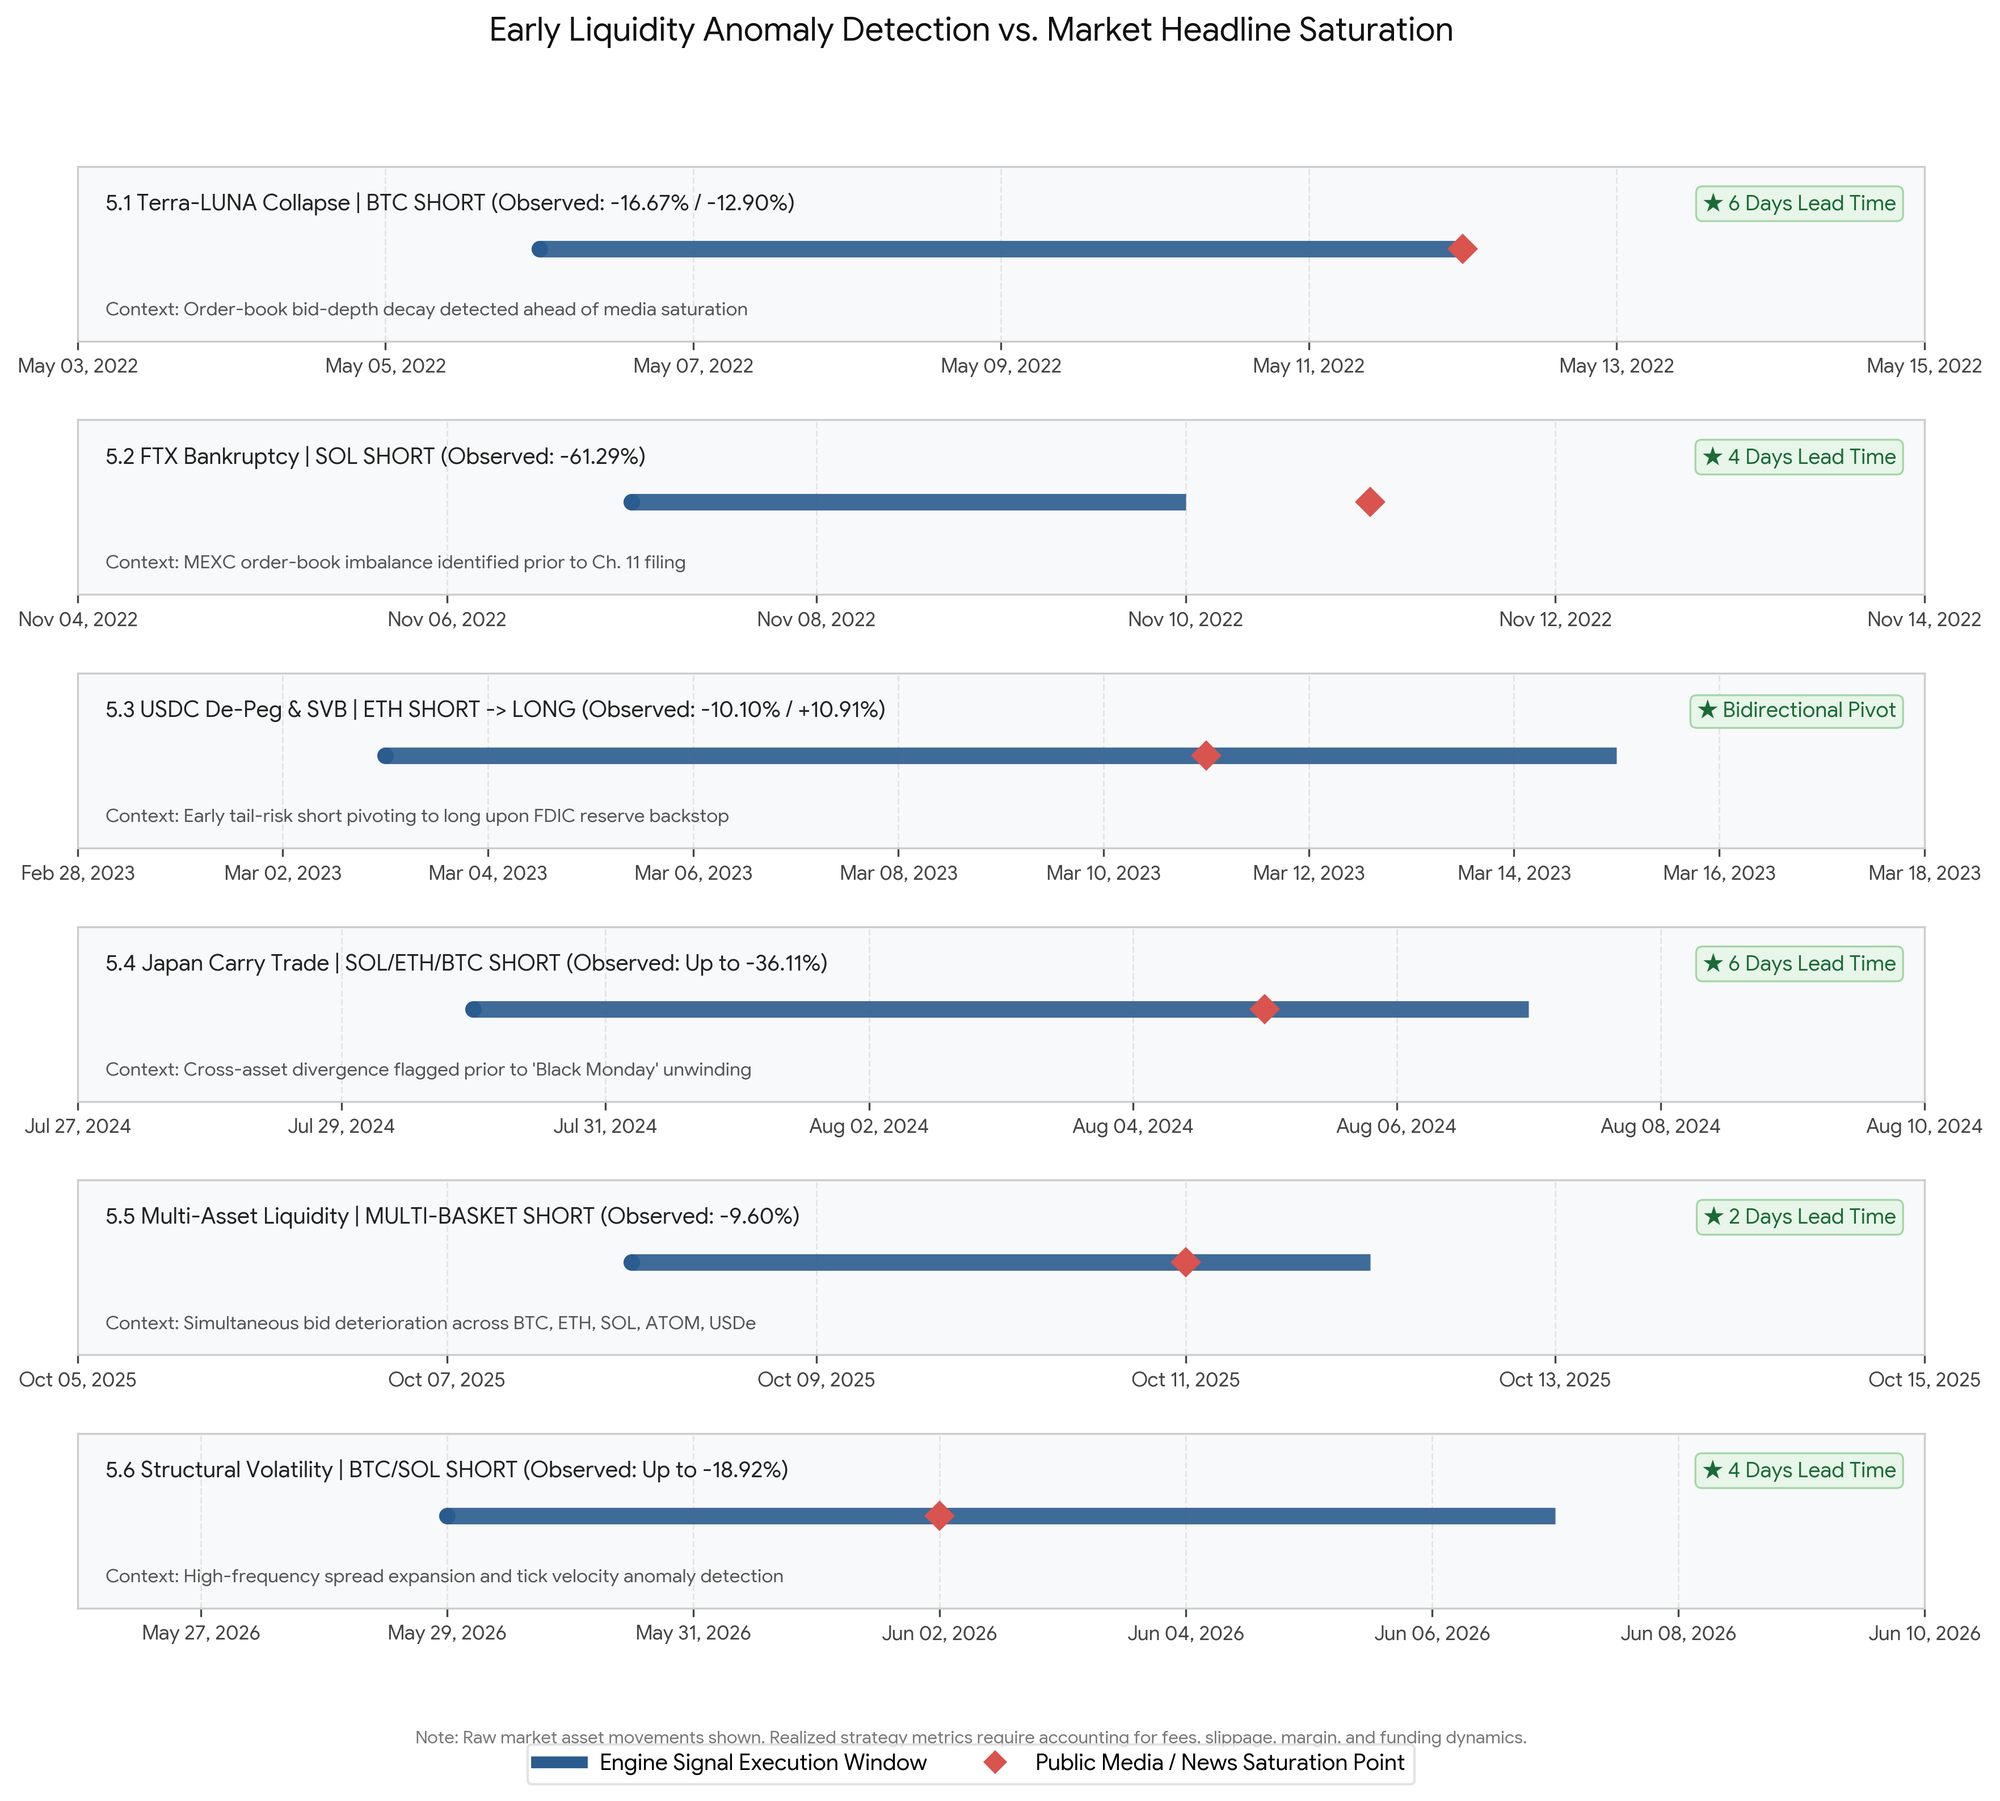
- System observation: On May 6, 2022—preceding the acute phase of the TerraUSD (UST) and LUNA collapse—the engine detected a sharp, asymmetric contraction in BTC order-book depth alongside elevated cross-asset delta decay. The system generated short vector signals on BTC beginning May 6, 2022.
- External chronology & lead-time context: Mainstream financial reporting reached public saturation around May 12, 2022 (e.g., CNBC coverage of the historic LUNA collapse). This demonstrates a 6-day chronological separation between the system's real-time detection of order-book stress and subsequent broad-market headline saturation.
This observation highlights that market microstructure indicators—specifically bid-depth decay and cross-asset correlation breakdowns—can signal severe liquidity stress days before those conditions are fully synthesized in public financial media. It is presented as evidence of early liquidity anomaly detection, not as proof that the algorithm possessed causal predictive knowledge of the underlying protocol failure.
| Asset | Direction | Entry Date | Exit Date | Entry Price | Exit Price | Observed Price Change (%) |
|---|---|---|---|---|---|---|
| BTC | SHORT | May 6, 2022 | May 11, 2022 | $36,000.00 | $30,000.00 | -16.67% |
| BTC | SHORT | May 11, 2022 | May 12, 2022 | $31,000.00 | $27,000.00 | -12.90% |
Note: Price changes reflect raw market asset movements between recorded timestamps. Realized strategy performance requires accounting for fees, slippage, funding rates, margin requirements, and liquidation dynamics.
5.2 FTX & Alameda Insolvency Cascade (November 2022)
- System observation: On November 7, 2022, four days prior to FTX’s formal Chapter 11 bankruptcy filing, the engine identified severe liquidity fragmentation and ask-side order-book imbalance in SOL/USDT market pairs on MEXC.
- External chronology: FTX filed for Chapter 11 bankruptcy on November 11, 2022. The system recorded its earliest short observation on November 7, capturing the downward volatility expansion prior to the public filing saturation.
| Asset | Direction | Entry Date | Exit Date | Entry Price | Exit Price | Observed Price Change (%) |
|---|---|---|---|---|---|---|
| SOL | SHORT | Nov 7, 2022 | Nov 10, 2022 | $31.00 | $12.00 | -61.29% |
5.3 USDC De-Pegging & Regional Banking Crisis (March 2023)
- System observation: Following emerging regional bank stress, the engine triggered an initial ETH short position on March 3, 2023. On March 13, following public confirmation of FDIC reserve backstops for Circle's underlying deposits, the model executed a bidirectional pivot to a long position as order-book liquidity re-stabilized.
- External chronology: The USDC de-peg occurred over the weekend of March 10–11, 2023, following Silicon Valley Bank's closure. The system's March 13 long signal recorded the transition from tail-risk liquidity deterioration back to mean-reversion recovery.
| Asset | Direction | Entry Date | Exit Date | Entry Price | Exit Price | Observed Price Change (%) |
|---|---|---|---|---|---|---|
| ETH | SHORT | Mar 3, 2023 | Mar 11, 2023 | $1,564.00 | $1,406.00 | -10.10% |
| ETH | LONG | Mar 13, 2023 | Mar 15, 2023 | $1,540.00 | $1,708.00 | +10.91% |
5.4 Japan Carry Trade Unwind / Black Monday (August 2024)
- System observation: Macro-liquidity and cross-asset divergence metrics flagged institutional unwinding beginning July 30, 2024. The platform generated short signals across SOL, ETH, and BTC ahead of the sharp global asset liquidation event on August 5.
- External chronology: Global financial markets experienced severe volatility on August 5, 2024 ("Black Monday"), driven by the unwinding of the Japanese yen carry trade. The system's earliest observation led the peak volatility event by approximately 6 days.
| Asset | Direction | Entry Date | Exit Date | Entry Price | Exit Price | Observed Price Change (%) |
|---|---|---|---|---|---|---|
| SOL | SHORT | Jul 30, 2024 | Aug 5, 2024 | $180.00 | $115.00 | -36.11% |
| ETH | SHORT | Jul 31, 2024 | Aug 3, 2024 | $3,293.00 | $2,960.00 | -10.11% |
| BTC | SHORT | Aug 3, 2024 | Aug 6, 2024 | $63,000.00 | $54,000.00 | -14.29% |
| ETH | SHORT | Aug 4, 2024 | Aug 7, 2024 | $2,892.00 | $2,459.00 | -14.97% |
5.5 Multi-Asset Liquidity Disruptions (October 2025)
- System observation: Correlated liquidity anomaly detection flagged simultaneous bid-side depth deterioration across BTC, ETH, SOL, ATOM, and USDe on October 8, 2025, initiating a basket short signal ahead of a multi-asset liquidity contraction window.
- External chronology: Regional market liquidity reporting highlighted widespread institutional deleveraging on October 10–11, 2025.
| Asset Basket | Direction | Entry Date | Exit Date | Basket Entry Index | Basket Exit Index | Observed Price Change (%) |
|---|---|---|---|---|---|---|
| MULTI-BASKET | SHORT | Oct 8, 6:00 PM | Oct 12, 9:00 AM | $122,326.00 | $110,584.00 | -9.60% |
5.6 Structural Volatility Expansion (May-June 2026)
- System observation: High-frequency spread expansion and tick-velocity anomalies on MEXC flagged downside liquidity imbalance starting May 29, 2026, generating early short vector signals on BTC and SOL prior to wider market contraction in early June.
- External chronology: Financial media reported accelerated market contractions on June 2, 2026.
| Asset | Direction | Entry Date | Exit Date | Entry Price | Exit Price | Observed Price Change (%) |
|---|---|---|---|---|---|---|
| BTC | SHORT | May 29, 2026 | Jun 7, 2026 | $74,000.00 | $60,000.00 | -18.92% |
| SOL | SHORT | Jun 2, 2026 | Jun 3, 2026 | $79.00 | $74.00 | -6.33% |
| SOL | SHORT | Jun 4, 2026 | Jun 7, 2026 | $73.00 | $61.00 | -16.44% |
6. Current Infrastructure Constraints
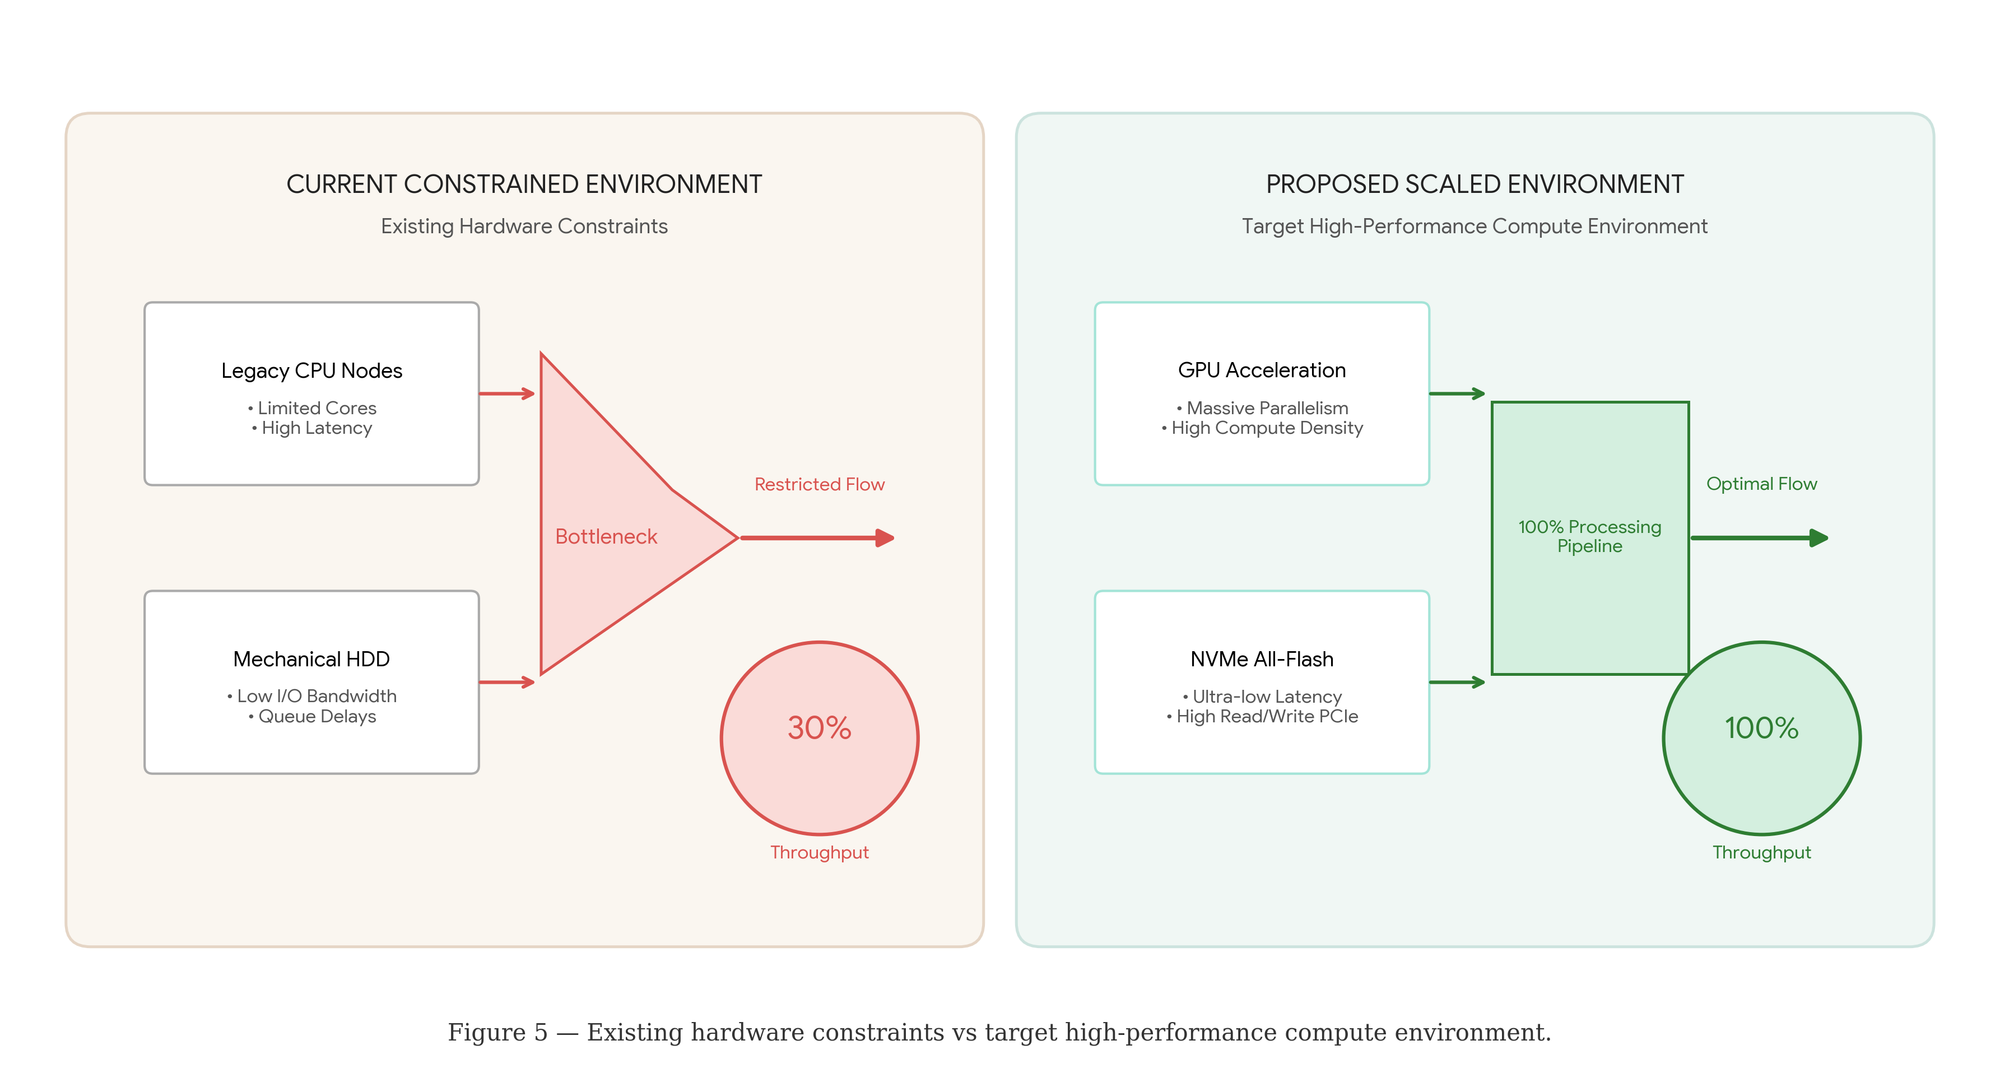
The current operational setup relies on retail-grade hardware. BIL reports that the current system handles approximately 30% of signal execution capacity due to compute and bandwidth bounds.
7. Multi-Venue Research Expansion
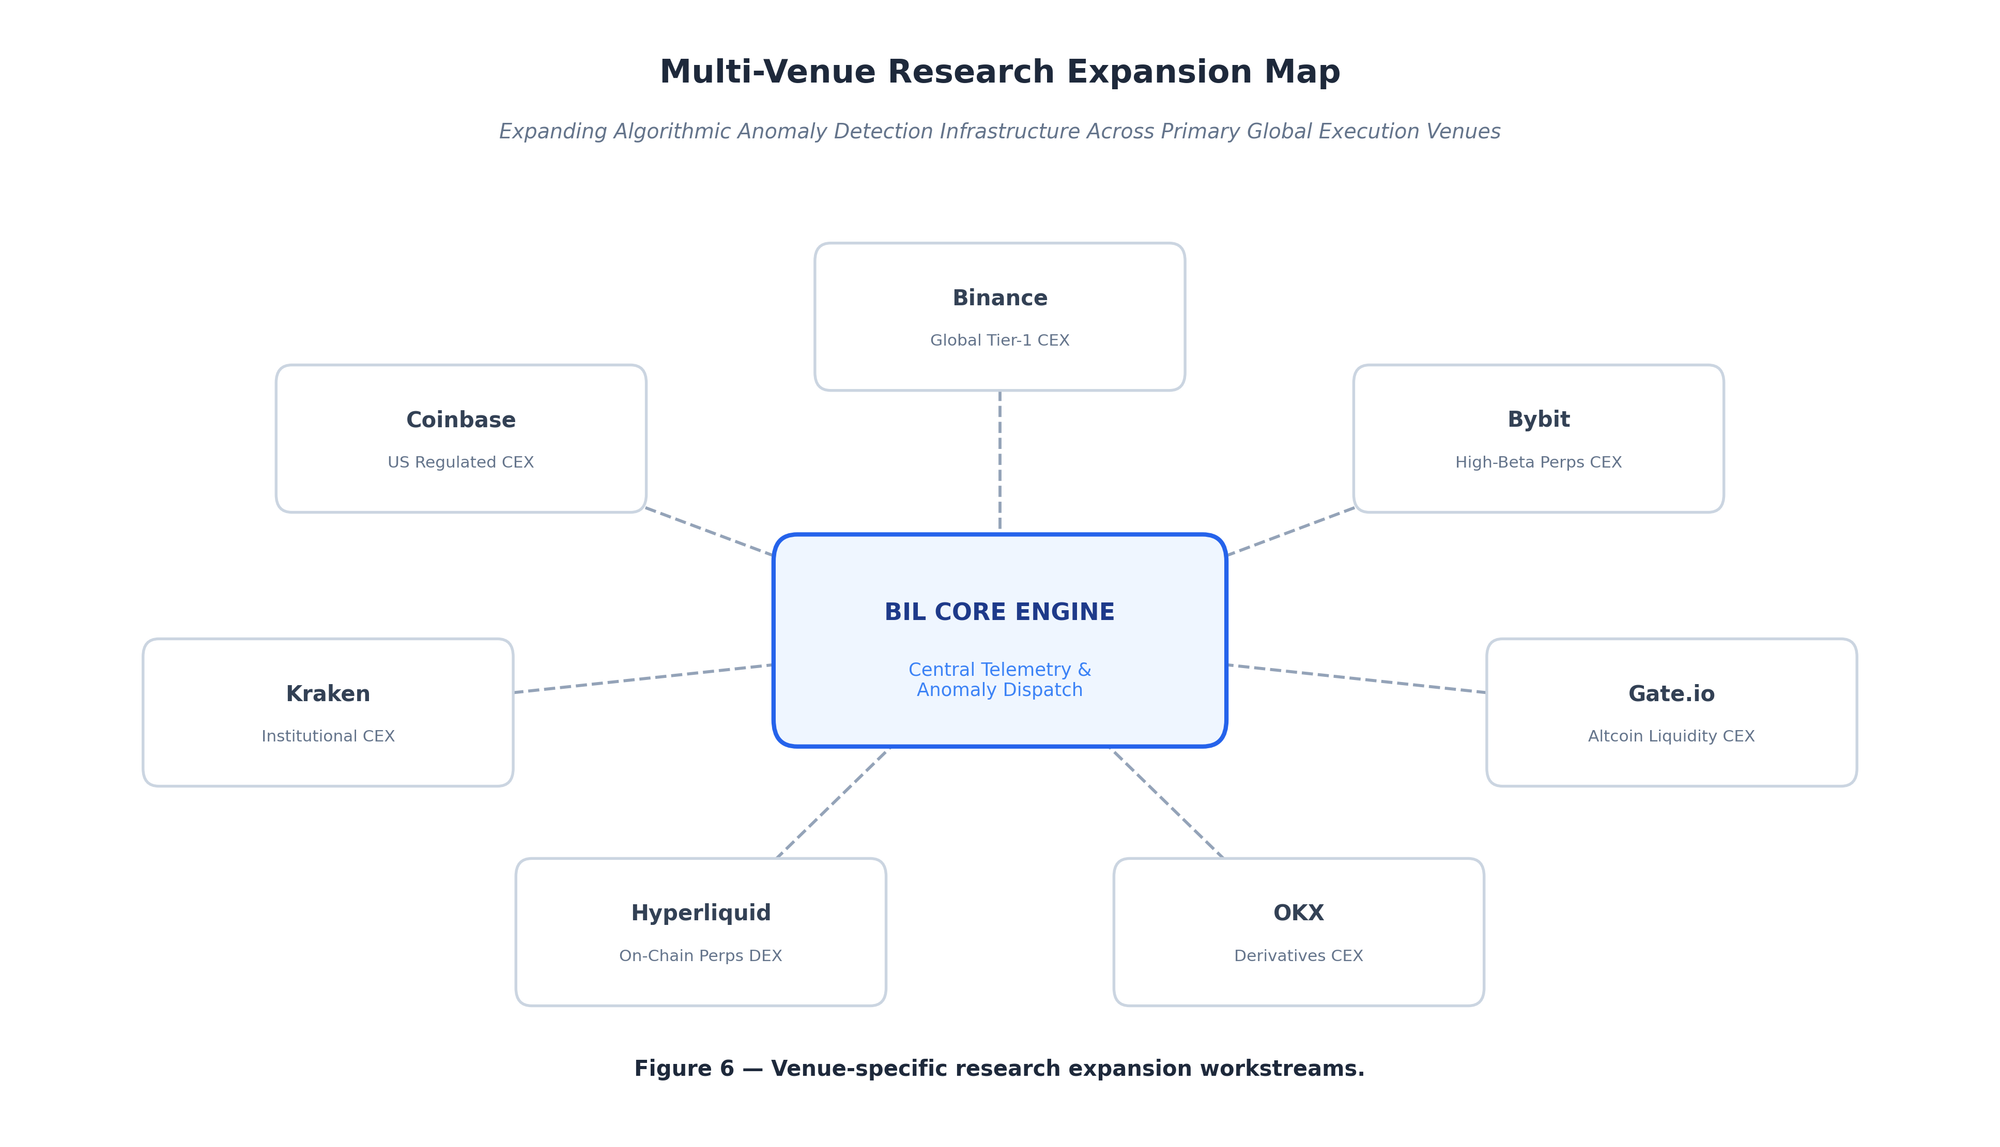
BIL is preparing separate research disclosures for Binance, Coinbase, Kraken, Hyperliquid, OKX, Gate.io, and Bybit as compute and storage capacity expand.
8. Research and Validation Roadmap
9. Conclusion
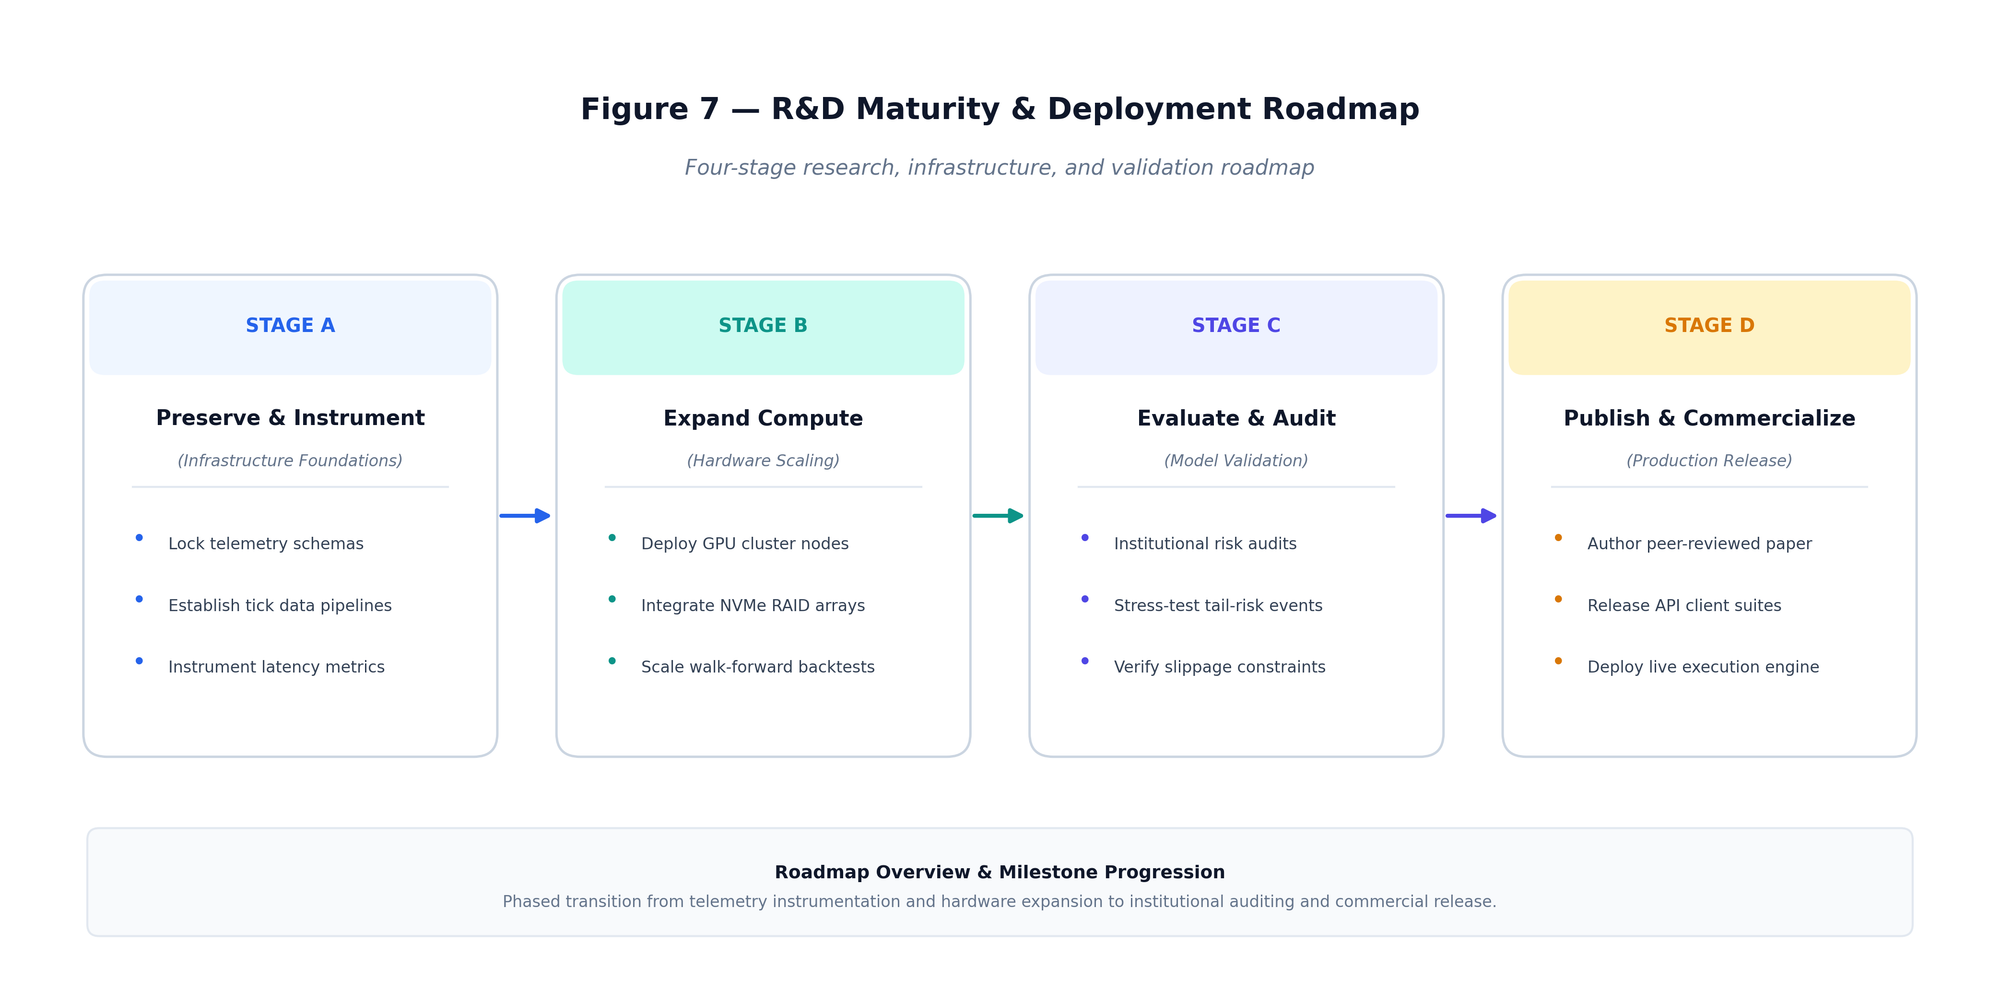
Bukluran Innovation Labs' ongoing research program demonstrates that systematic order-book monitoring can capture structural liquidity changes across diverse market regimes. Institutional research collaboration and infrastructure sponsorship are sought to expand processing throughput and advance the research toward institutional deployment.
CONTINUOUS RESEARCH & LIVING DOCUMENT NOTICE
This paper is maintained as a Living R&D Document under Bukluran Innovation Labs (BIL). As our bare-metal infrastructure expands and additional walk-forward backtests, live telemetry datasets, and experimental regimes are evaluated across various centralized and decentralized liquidity venues, this document will be updated with new empirical tables, stress-test regimes, and comparative architectural benchmarks.
PUBLISHING & DISCLAIMER NOTICE
This research document is authored and published by Bukluran Innovation Labs (BIL) for quantitative research, infrastructure modeling, and algorithm validation. All backtest metrics reflect historical walk-forward replay outputs on MEXC tick data. This paper does not constitute financial advice or investment solicitation. Platform execution models operate autonomously under proprietary mathematical frameworks.

Power Our Mission, Shape the Future
We empower single parents, PWDs, youths, seniors, and stay-at-home parents through digital livelihood.
Help us build resilient communities.
BUKLURAN remains open to partnerships, sponsorships, and collaborative initiatives that create meaningful community impact.
Whether through funding, in-kind support, volunteerism, or shared services, your organization can help strengthen programs that serve underserved communities.
Do you want to take part in our free livelihood programs, scholarship assistance, and community resource pooling initiatives? Membership is completely free.
Join BUKLURAN!
Register, volunteer, and become a member today.